| |
NIMBUS Watch Public cloud version |
NIMBUS Watch Private cloud version |
| Usage Method (APP) |
Through "NIMBUS Watch APP" |
Through "NIMBUS Watch Private Cloud APP" |
| Install Monitoring Module |
Not Required |
Must install "NIMBUS Watch Private Cloud Monitoring Module" internally in the company |
| Data Storage Location |
Stored in Public Cloud |
Stored Internally in the Company |
| Service Deactivation |
Basic monitoring items will be automatically deactivated if not logged in for over six months. Other paid module items will be deactivated one month after expiration. |
Basic monitoring items will not be automatically deactivated. Other paid module items will be deactivated one month after expiration. |
| APP Connection Method |
https |
http or https (depending on internal company settings) |
| Login Method |
Integrated OAuth2.0, providing login authentication methods via Facebook, Google, CAMP, and Weibo |
Local Account: Use the local account of the host where the private monitoring module is installed. As long as you can log in to the host, you can log in to NIMBUS Watch Private Cloud Version.
AD Account: Integrates with the internal AD Domain authentication method, eliminating the need for additional personnel list maintenance by directly integrating with the AD account. |
| Push Notification Recipients |
Can only push to yourself |
Can push notifications to other people in the same company (same monitoring module node) |
| Monitoring items |
Ping, Port, Web URL, Windows Service, IIS Application Pool, Windows Task Scheduler, Windows Event Viewer, SQL Server Connection, SQL Server Transaction Log Size, SQL Server Task Scheduler, SQL Server Data Locking, Execute SQL Command, Windows Disk Size, Windows Performance, Custom Push Notification (API), Windows Performance (Advanced), Windows Event Viewer (Advanced), ODBC DSN Connection, Windows File Existence Time, Web Post Monitoring, Ceph OSD Daemon, SNMP Disk Size, SNMP Performance, SNMP Network Traffic, IPMI Sensor, IPMI OS Boot, Zabbix Alarm, MySQL Connection, MySQL Data Locking, MySQL Task Scheduler, MySQL Status, SMTP, Custom Push Notification (Database), Custom Push Notification (ODBC), Custom Push Notification (Text File), Custom Push Notification (Email), Web Test, Grafana, cAdvisor, Oracle Connection, Oracle Datafiles, Oracle Tablespace, Oracle Task Scheduler, Oracle Data Locking, Execute Oracle Command, and UNC Path Connection (refer to the description below) |
| Auto-start |
Can set auto-start when IIS Application Pool or Windows Service stops |
| Notification methods |
Email, Push Notification |
| Email sending method |
Send Email through public cloud |
Send Email through company's internal SMTP |
| Push notification method |
Push notification through public cloud |
| Number of notification messages retained |
Only the last three alarm messages are retained for each monitoring item on each monitoring host |
| Monitoring rules |
Custom rules are used to set monitoring and alarm rules by day, weekday, weekend, and by week
-
Monitoring rules provide system default and custom options. Custom options can be:
Monitoring interval (minutes, hours, days)
Monitoring timeout (10 seconds, 20 seconds, 30 seconds)
Retry interval (1 minute, 5 minutes, 10 minutes)
Number of retries (0 times, 1 time, 2 times, 3 times)
-
Alarm rules are divided into:
Send on error
Send only once for the same error
Send after accumulating several errors (1 time, 2 times, 3 times)
Resend after a certain time (minutes, hours, days)
|
| Supports multiple account logins |
Yes
(But limited to four login methods) |
Yes
(Can log in based on the node where the monitoring module is located) |
| Supports multi-node login |
No
(Can only connect to public cloud) |
Yes
(No matter how many monitoring module nodes are installed, they can be managed through the same APP) |
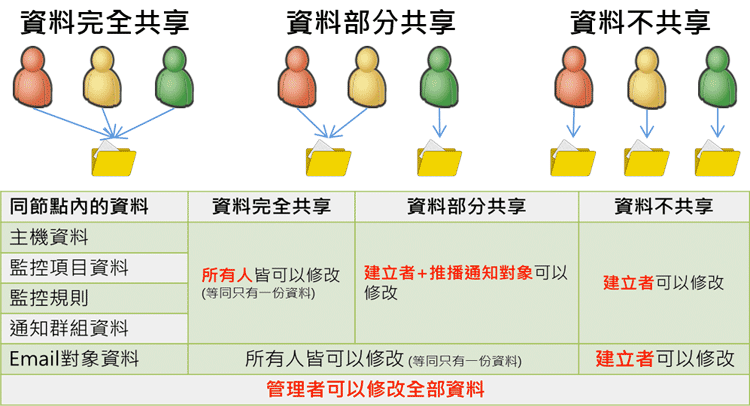
| Data permissions |
Can only see data created by themselves |
Three data sharing modes (refer to the description below) |
| Administrator role |
Cannot be set |
Can set administrator role, the administrator can manage all data under the monitoring module |